Chapter 4 Training Models
Hands-On Machine Learning with Scikit-Learn, Keras & Tensorflow 2nd Edition by A. Geron
2章、3章で、housingデータを使ったregressionと、MNISTデータを使ったclassifierを学んで、いろいろなモデルやテクニックを実際に使うことで、すぐにでも、自分でなにかできそうな気がしてくるのだが、そんなに甘くはない。
このあたりまではしっかり読むが、ここからは、なにか分かった気になってつまみ食いに走るのだろう。
そして、気が付いたときには、プログラムが一行も書けない自分がそこにいる。
ということにならないように、がんばろう。
Introduction
2章と3章で、machine learning models とtraining algorithmsの大部分を、black boxとして扱ってきた。regression systemのoptimizationやdigit image classifierのimprovementもやってきた。Exerciseではspam classifierをゼロから作ってきた。それらの詳細を知らないでやってきた。多くの場合、実装の詳細まで知る必要はない。
しかしながら、それでは、適切なモデルの選定も、適切なデータの前処理も、適切なモデルの学習も、モデルの性能向上のためのハイパーパラメータの設定も、できないであろう。さらに、機械学習の根本を理解しておけば、デバッグや、エラー解析を効率的に行えるであろう。これらの議論は、テキストの後半で取り組むニューラルネットワークの構築や学習、高性能化においても同様に、重要である。
Linear Regression
*数式とその説明がたくさん出てくるが、ここには直接記述するのが難しいし、他で書いてここに張り付けるのも面倒なので、記事としては、わけのわからないものになってしまう。
線形回帰モデルは、
y-hat = θ0 + θ1x1 + θ2x2 + θ3x3 +・・・+ θnxn
y-hat : the predicted value
n : the number of features
xi : i-th feature value
θj : j番目のパラメータ
featureとパラメータとの単純な線形結合で表されるLinear regressionは単純明快。
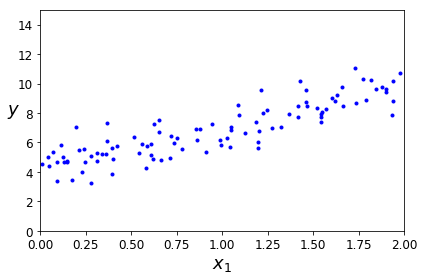
線形に見えるデータを乱数を使って発生させ、解析してみせるということのようだ。
The Normal Equation
import numpy as np
X = 2 * np.random.rand(100, 1)
y = 4 + 3 * X + np.random.randn(100, 1)
randは、0~+1の範囲でランダムな数値を出力する。
randnは、平均0、 標準偏差1の正規分布で、ランダムな数値を出力する。
X_b = np.c_[np.ones*1, X] # add x0 = 1 to each instance
theta_best = np.linalg.inv(X_b.T.dot(X_b)).dot(X_b.T).dot(y)
theta_best
array([[4.21509616],
[2.77011339]])
make a prediction
X_new = np.array([[0], [2]])
X_new_b = np.c_[np.ones*2, X_new] # add x0 = 1 to each instance
y_predict = X_new_b.dot(theta_best)
y_predict
array([[4.21509616],
[9.75532293]])
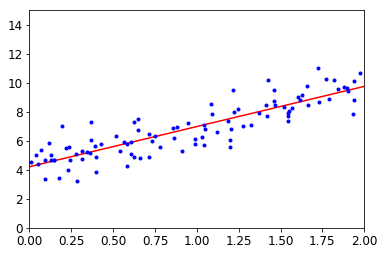
Let's plot this model's predictions (Figure 4-2):
plt.plot(X_new, y_predict, "r-")
plt.plot(X, y, "b.")
plt.axis([0, 2, 0, 15])
plt.show( )
これを、Scikit-Learn のLinear Regressionで実行すると、
from sklearn.linear_model import LinearRegression
lin_reg = LinearRegression( )
lin_reg.fit(X, y)
lin_reg.intercept_, lin_reg.coef_
(array([4.21509616]), array(2.77011339))
lin_reg.predict(X_new)
array([[4.21509616],
[9.75532293]])
The LinearRegression class is based on the scipy.linalg.lstsq( ) functions (the name stands for "linear squares"), which you could call directry:
theta_best_svd, residuals, rank, s = np.linalg.lstsq(X_b, y, rcond=1e-6)
theta_best_svd
array([[4.21509616],
[2.77011339]])
You can use np.linalg.pinv( ) to compute the pseudoinverse directly.
np.linalg.pinv(X_b).dot(y)
array([[4.21509616],
[2.77011339]])
最後に、seudoinverseの計算方法、Singular Value Decomposition (SVD):特異値分解を用いる方法について説明している。
SVDは、残念ながら、フォローできない。
Computational Complexity
前節に引き続き、計算方法について説明しているようである。
Gradient Descent
Gradient Descentは、wide range of problemsに対して、optimal solution を見つけることができるgeneric optimization algolismである。general idea of Gradient Descentは、cost functionをminimizeするためにparameterをiterativeにtwak(微調整)することである。
山で濃霧に遭って道に迷ったら、足元の傾斜だけが頼りになる。早く下山するためには傾斜が最も大きい方向に沿って移動するのが良い。Gradient Descentはこれと同じで、parameter vector θに対するerror functionのlocal gradientを測り、傾斜が大きい方向に移動する。傾斜がゼロになったところでerror functionが最小になる。
learning rateを適切に選ぶことが重要。
local minimum がありうる。learning rateと関係するところもある。
caution:全てのfeatureのスケーリングが重要(必須)である。
Batch Gradient Descent
重要な式を、自分が理解できなくても、ここに示せればよいのだが、断念します。
プログラムコードを写しておきます。
eta = 0.1 # learning rate
n_iterations = 1000
m = 100
theta = np.random.randn(2,1) # random initialization
for iteration in range(n_iterations):
gradients = 2/m * X_b.T.dot(X_b.dot(theta) - y)
theta = theta - eta * gradients
theta
array([[4.21509616],
[2.77011339]])
次の図はlearning rate eta を変えた場合の、最初の10ステップを示している。
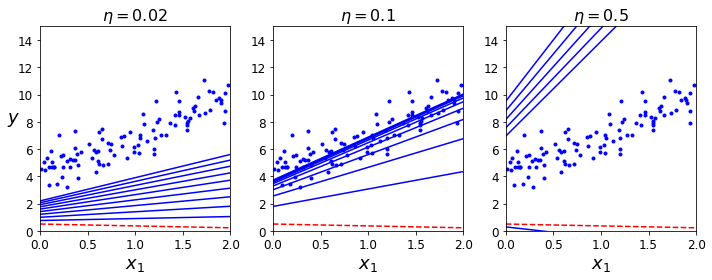
左の図に示されているように、learning rateが小さいと、時間がかかる。しかし、解には近づいていく。
learning rateが適切であれば、中央の図に示されるように少ない回数で解に到達する。
右の図に示されているように、learning rateが大きすぎると、発散してしまって解に到達できないことになる。
適切なlearning rateを得るためには、2章で紹介したgrid searchiを用いるのが良い。
ただし、learning rateが大きすぎると収束せず、learning rateが小さすぎると時間がかかるので、最初はステップを大きくとってみるとか、iteration numberを小さめにとって多くのパラメータを試すとか、ランダムサーチを使ってみるとか、いろいろ試す必要がある。調べる範囲が偏ってしまって、いつまで経っても最適値が得られないということは避けたい。結果が出始めたら、途中で、learning rateと所要時間と最小値の値をプロットして傾向を調べることも大切だ。
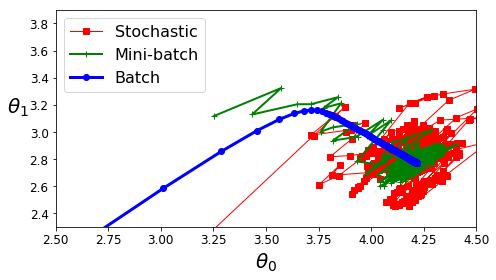
Stochastic Gradient Descent
Mini-batch Gradient Descent
polynomial Regression
What if your data is more complex than a stright line?
Surprisingly, you can use a linear model to fit nonlinear data.
A simple way to do this is to add powers of each feature as new features, then train a linear model on this extended set of features.
This technique is called Polynomial Regression.
Let's look at an example.
First, let's generate somo nonlinear data, based on a simple quadratic equation (plus some noise; see figure 4-12):
m = 100
X = 6 * np.random.rand(m, 1) - 3
y = 0.5 * X**2 + X + 2 + np.random.randn(m, 1)
Clearly, a straight line will never fit this data property.
So let's use Scikit-Learn's PolynomialFeatures class to transform our training data, adding the square (second-degree polynomial) of each feature in the training set as a new feature (in this case there is just one feature):
from sklearn.preprocessing import PolynomialFeatures
poly_features = Polynomiaatures(degrelFee=2, include_bias=False)
X_poly = poly_features.fit_transform(X)
X[0]
array([-0.75275929])
X_poly
array([-0.75275929, 0.56664654])
X_poly now contains the original feature of X plus the square of this feature.
Now you can fit a LinearLigression model to this extended training data (Figure 4-13):
lin_reg = LinearRegression( )
lin_reg.fit (X_poly, y)
ylin_reg.intercept_, lin_reg.coef_
(array([1.78134581]), array(0.93366893, 0.56456263))
*特徴量として2次のPolynomialFeaturesを追加すれば、LinearRegression modelでフィッティングできるということだ。
Not bad: the model estimates y-hat = 0.56*x1^2 + 0.93*x1 + 1.78 when in fact the original function was y = 0.5*x1^2 + 1.0*x1 +2.0 + Gaussian noise.
Note that when there are multiple features, Polynomial Regression is capable of finding relationships between features (which is something a plain Linear Regression model cannot do).
This made possible by the fact that PolynomialFeatures also adds all combinations of features up to the given degree.
For example, if there were two features a and b, PolynomialFeatures with degree=3 would not only add the features a^2, a^3, b^2, and b^3 but also the combinations ab, a^2b, and ab^2.
PolynomialFeatures (degree=d) transforms an array containing n features into an array containing (n + d)!/d!n! features, where n! is the factorial of n, 1 x 2 x 3 x ... x n.
Beware of the combinatorial explosion of the number of features!
Learning Curves
Regularized Linear Models
Ridge Regression
Lasso Regression
Elastic Net
Early Stopping
Logistic Regression
Estimating Probabilities
Training and Cost Function
Decision Boundaries
Softmax Regression
Cross Entropy
